I am a big fan of NASA's educational materials. I wrote previously about using a lesson from Mission Mathematics as part of problem solving in math. NASA also has an excellent geography curriculum, Mission Geography, which is available free on the NASA website. They have created different curricula for grades K-4, 5-8, and 9-12. Teaching a gifted 4th grade class, I have used units from both the K-4 and 5-8 bands.
My class has just completed Investigation 1 in the unit "Mars and Earth - the Quest for Life." This is part of the 5-8 units. Investigation 1 is "Where do we choose to live and why?" This is a question our 4th graders have been exploring for the entire school year in Social Studies, beginning with the early English colonies. In an earlier blog post I shared the lesson plan from Colonial Williamsburg in which students are charged with examining the characteristics of several potential settlement sites, ranking them according to different criteria, and defending their choices of site. Later in the year, we saw the importance of waterways as transportation in the French and Indian War. We noted in colonial times leading up to the Revolutionary War that the colonies were all on the Atlantic coast and the major cities were all ports.
"Where do we choose to live and why?" reinforces these aspects of geography in history and brings the ideas into the present. In the first activity, Students are introduced to the concepts of patterns, dispersion and density in populations. Then students are given a satellite photo of New England at night, so what you see are the lights of human activity. The photo is not identified, so the first task students have is to identify from it was taken, what time of day it was, and what it is. There are a number of questions to answer about what can be seen in the photo, including, what are the completely dark areas (water), what patterns do you observe, and finally, what cities, water bodies, and other features can you identify. In my experience using this for a few year now, students usually need some scaffolding in understanding the concepts of pattern and dispersion when talking about human population, so I give additional examples beyond what Mission Geography offers. I also have students work in partners to have someone to discuss the questions with.
In the second activity, students receive a photo of the continental United States (and parts of Canada and Mexico), but it has been turned into a puzzle, being cut into eight rectangles. Their job is to reassemble it using their mental map of the country, with the night lights of cities as the guide. Most students can easily identify the east coast, and often California and Texas with the Gulf of Mexico The center of the country is the challenge. At this point I encourage students to use an atlas, look for the major cities, and assemble the country from those clues. There is a more extensive set of questions to answer after putting the country together. Some questions ask students to think about why there are no cities in parts of the continent. Using an atlas, they discover that the more empty portions of the country are mountains and deserts. They also use a plastic overlay and markers to outline the U.S. and highlight certain features. This is always a popular part of the activity! I collect the clear plastic from the ends of laminating to use as the overlays.
So far these activities have been a cooperative effort, working with partners, and then discussing answers as a whole class. The final activity in this section is applying everything they have learned to determine where people would settle on an unidentified satellite photo of Australia. This photo is a color image designating elevation. I have been disappointed in past years when I taught this lesson because my students had difficulty in successfully picking logical places to settle. They would often pick a place in the middle of Australia, rather than the coastlines, even though we has been discussing this for most of the school year. I decided that part of the problem was with a lack of scale. Though many of my students recognized that it was Australia, they didn't have a clear idea of how big the country/continent is. So this year I gave them the area and the distance north to south and east to west. Another possible issue is the color code for elevation uses a deep green for the lowest elevation, which may give a mistaken impression of lush forests. Students had frequently chosen the center of Australia as a good place to settle, while in reality is is about a thousand miles from the coastline and a desert. This year I went over the color code carefully.
I had students begin work alone and after about 15 or 20 minutes offered them a chance to partner up and share their ideas. This gave me time to walk around checking on understanding and misconceptions before they worked together. I was very pleased with the results of these tweaks. Almost all of my students demonstrated understanding of what people look for in a settlement, as well as the types of places people tend to live.
NASA's Mission Geography gives context to geographical concepts and allows students to apply them. Students are required to think and use what they know. There are many more units than the ones I use - I wish I had more time to teach geography!
Showing posts with label NASA. Show all posts
Showing posts with label NASA. Show all posts
Monday, May 25, 2015

Tuesday, April 7, 2015
Houston, we are set for launch
When you're trying to add more problem solving opportunities to the curriculum, math is a natural area. A valuable source for math and science problem solving is Mission Mathematics, jointly published by the National Council of Teachers of Mathematics and NASA. The book is available at four different grade levels ranging from preschool through high school. It contains many activities that require students to apply their math knowledge to successfully complete investigations that incorporate aeronautics, astronomy, and other space-related subjects. I have used activities with both kindergartners and 3rd and 4th graders.
One of the investigations that my partner and I do every year is the Protractor Rocket Launches. Like the other activities in Mission Mathematics, this is a structured investigation. Students are presented with the question of what will happen when a rubber band is launched at three different angles, 30, 60 and 90 degrees. They are given instructions on how to construct a launcher using a protractor, ruler, and tape. Then they use this to collect data by launching multiple times at the three different angles. Students work in small groups throughout this activity, which is a valuable collaborative experience.
Over the years, I have tweaked and added to the original directions for the lesson. I have students write their predictions before beginning. Most of my students realize that a rubber band shot at a 90 degree angle will go straight up, but they don't always intuit from that that a 60 degree launch will not go as far as a 30 degree one. A 30 degree launch can go quite far - we go into the hallways for the launching part of this activity.
After the data is collected, we have students find the statistical landmarks, and then, thinking about what they learned from this experiment about angles of launch, they decide how best to graph the data. They have already spend a significant number of math classes on data and graphing, so at this point I stress to them that their goal is to communicate the big idea of this experiment, so how they choose to graph it must clearly show that big idea. I have had students try line graphs, bar graphs, line plots, and stem and leaf plots. Thankfully, no one has ever thought that a circle graph would work. Many 4th graders think they need to graph every single launch, while others realize that they can use the mean or median to communicate the important information. We use all of those choices to discuss what really is the big idea - that 30 degree launches go the furthest, 90 degrees goes the least far because it is going straight up, and 60 degrees is in the middle. Then we look at the variety of choices in graphing and think about which kind of graph best communicates this.
We also have students answer questions about whether one angle of launch is "best," or if there are appropriate uses for each angle. I also ask them to think about how they might improve the experiment or add onto it if they were going to launch more rubber bands. I have found that students often focus on other variables in the experiment that were not controlled for, such as how far everyone is pulling back the rubber band before letting it launch. These questions are often homework.
Altogether, this project takes us about 3 days.
This is a more structured experience than some of the open design thinking projects, but it requires thoughtful decision making, use of real collected data, and making connections to real life applications. It is also a productive break from the normal math lessons and an opportunity to use collaborative skills. Kids really enjoy this break from routine!
One of the investigations that my partner and I do every year is the Protractor Rocket Launches. Like the other activities in Mission Mathematics, this is a structured investigation. Students are presented with the question of what will happen when a rubber band is launched at three different angles, 30, 60 and 90 degrees. They are given instructions on how to construct a launcher using a protractor, ruler, and tape. Then they use this to collect data by launching multiple times at the three different angles. Students work in small groups throughout this activity, which is a valuable collaborative experience.
Over the years, I have tweaked and added to the original directions for the lesson. I have students write their predictions before beginning. Most of my students realize that a rubber band shot at a 90 degree angle will go straight up, but they don't always intuit from that that a 60 degree launch will not go as far as a 30 degree one. A 30 degree launch can go quite far - we go into the hallways for the launching part of this activity.
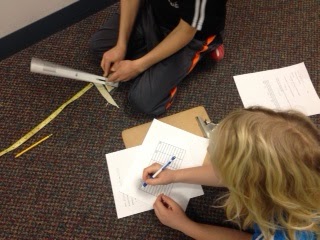 |
| Launching rubber bands and recording data |
After the data is collected, we have students find the statistical landmarks, and then, thinking about what they learned from this experiment about angles of launch, they decide how best to graph the data. They have already spend a significant number of math classes on data and graphing, so at this point I stress to them that their goal is to communicate the big idea of this experiment, so how they choose to graph it must clearly show that big idea. I have had students try line graphs, bar graphs, line plots, and stem and leaf plots. Thankfully, no one has ever thought that a circle graph would work. Many 4th graders think they need to graph every single launch, while others realize that they can use the mean or median to communicate the important information. We use all of those choices to discuss what really is the big idea - that 30 degree launches go the furthest, 90 degrees goes the least far because it is going straight up, and 60 degrees is in the middle. Then we look at the variety of choices in graphing and think about which kind of graph best communicates this.
We also have students answer questions about whether one angle of launch is "best," or if there are appropriate uses for each angle. I also ask them to think about how they might improve the experiment or add onto it if they were going to launch more rubber bands. I have found that students often focus on other variables in the experiment that were not controlled for, such as how far everyone is pulling back the rubber band before letting it launch. These questions are often homework.
Altogether, this project takes us about 3 days.
This is a more structured experience than some of the open design thinking projects, but it requires thoughtful decision making, use of real collected data, and making connections to real life applications. It is also a productive break from the normal math lessons and an opportunity to use collaborative skills. Kids really enjoy this break from routine!
Subscribe to:
Posts (Atom)