When you're trying to add more problem solving opportunities to the curriculum, math is a natural area. A valuable source for math and science problem solving is
Mission Mathematics, jointly published by the National Council of Teachers of Mathematics and NASA. The book is available at four different grade levels ranging from preschool through high school. It contains many activities that require students to apply their math knowledge to successfully complete investigations that incorporate aeronautics, astronomy, and other space-related subjects. I have used activities with both kindergartners and 3rd and 4th graders.
One of the investigations that my partner and I do every year is the Protractor Rocket Launches. Like the other activities in Mission Mathematics, this is a structured investigation. Students are presented with the question of what will happen when a rubber band is launched at three different angles, 30, 60 and 90 degrees. They are given instructions on how to construct a launcher using a protractor, ruler, and tape. Then they use this to collect data by launching multiple times at the three different angles. Students work in small groups throughout this activity, which is a valuable collaborative experience.
Over the years, I have tweaked and added to the original directions for the lesson. I have students write their predictions before beginning. Most of my students realize that a rubber band shot at a 90 degree angle will go straight up, but they don't always intuit from that that a 60 degree launch will not go as far as a 30 degree one. A 30 degree launch can go quite far - we go into the hallways for the launching part of this activity.
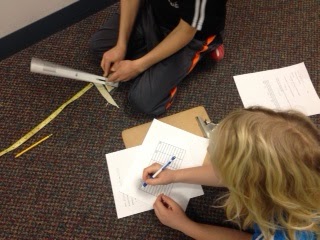 |
| Launching rubber bands and recording data |
After the data is collected, we have students find the statistical landmarks, and then, thinking about what they learned from this experiment about angles of launch, they decide how best to graph the data. They have already spend a significant number of math classes on data and graphing, so at this point I stress to them that their goal is to communicate the big idea of this experiment, so how they choose to graph it must clearly show that big idea. I have had students try line graphs, bar graphs, line plots, and stem and leaf plots. Thankfully, no one has ever thought that a circle graph would work. Many 4th graders think they need to graph every single launch, while others realize that they can use the mean or median to communicate the important information. We use all of those choices to discuss what really is the big idea - that 30 degree launches go the furthest, 90 degrees goes the least far because it is going straight up, and 60 degrees is in the middle. Then we look at the variety of choices in graphing and think about which kind of graph best communicates this.
We also have students answer questions about whether one angle of launch is "best," or if there are appropriate uses for each angle. I also ask them to think about how they might improve the experiment or add onto it if they were going to launch more rubber bands. I have found that students often focus on other variables in the experiment that were not controlled for, such as how far everyone is pulling back the rubber band before letting it launch. These questions are often homework.
Altogether, this project takes us about 3 days.
This is a more structured experience than some of the open design thinking projects, but it requires thoughtful decision making, use of real collected data, and making connections to real life applications. It is also a productive break from the normal math lessons and an opportunity to use collaborative skills. Kids really enjoy this break from routine!